Dashboard
Campaign analytics is included with every subscription. You can analyse a single Campaign or multiple Campaigns to review cumulative performance.
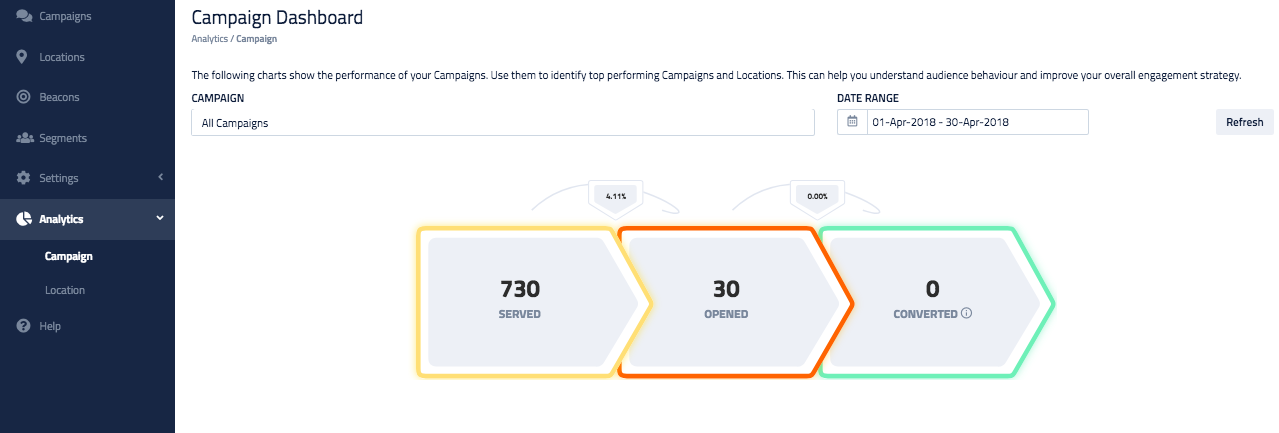
Timezone
Remember to modify the time zone to analyse campaign in the time zone where majority of your user's reside.
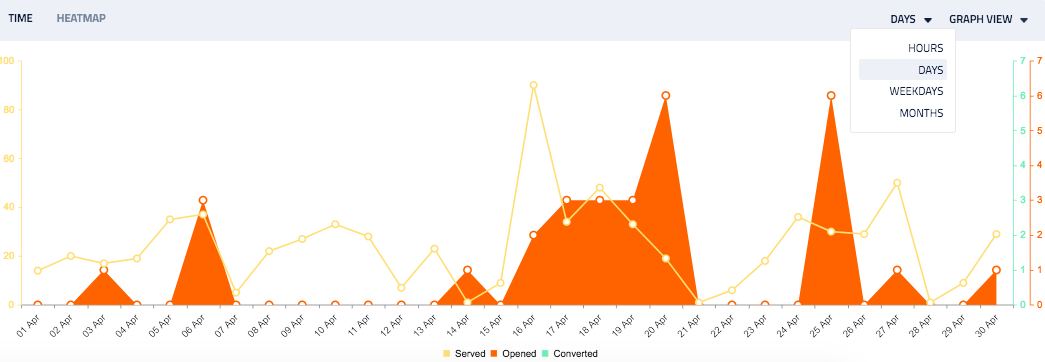
Timeseries Analytics
This widget can be used to analyse campaign performance by :
- Day of the Month
- Hour of the Day
- Day of the Week
- Month
Location Analytics
This widget can be used to analyse campaign performance by Locations and Beacons to identify which places are getting the most visitors and engaged users. You can sort the data by Campaigns :
- Served
- Opened
- Converted
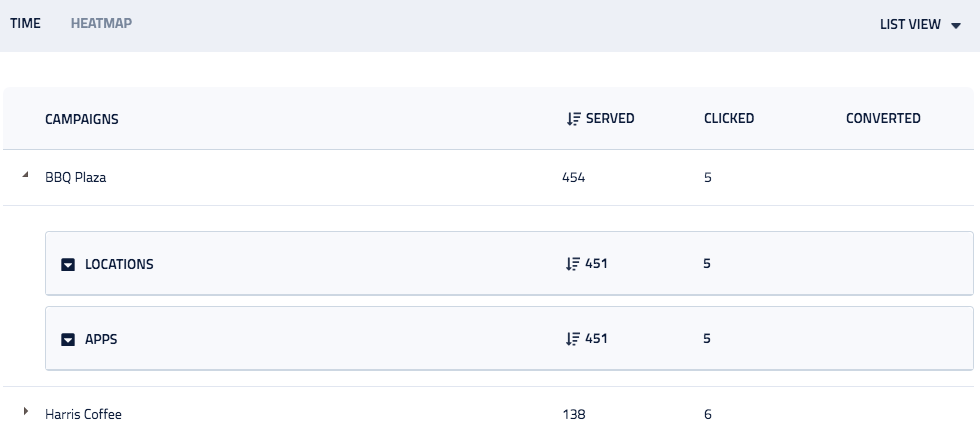
Conversion
The Conversion feature on Catalyst allows you to monitor the overall conversion rate of your Campaigns. This needs to be implemented by your developers to post Conversion data to Catalyst.
Heat Map Analytics
This widget can be used to analyse campaign performance using a heat map. Heat maps can be used to quickly identify hotspots where your userbase is most engaged.
The Campaign served (users who have received notifications) are shown in shades of blue, and users who have opened a Campaign are shown in red. Darker shades represent locations of higher reach and engagement.
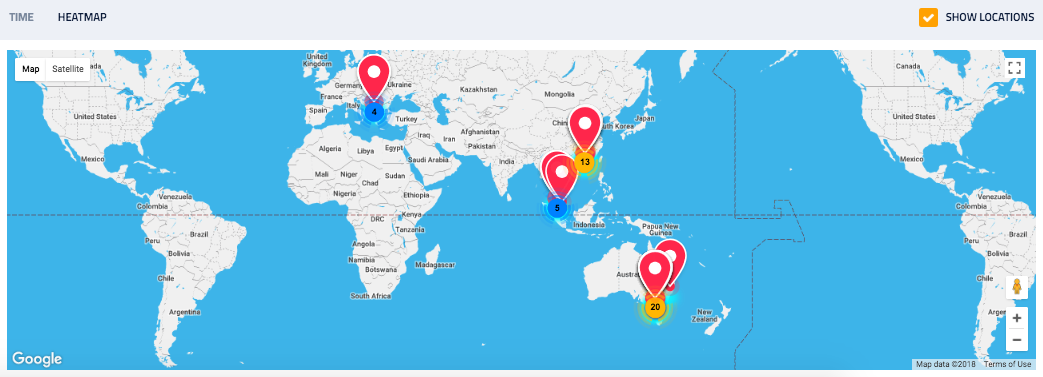
Location Markers
Un-check Show Locations to just see the heat map view. This can be useful to quickly identify hotspots. You can then see locations around hotspots for further analysis.